Hello TPA traders !
Here is a actual picture of the GBPCAD M15 chart, with the new TPA Sessions indicator and TPA True Price Action set to M15, period 21, price close (default for a reason), long term filter H1.
The colored lines showing the different sessions start and are extending till sessions start the next day. You can choose how many hours you would like see. If you like, you get a “heads up” alert, when price is moving towards sessions opening price, by choosing how many pips distance to the lines.
TPA Sessions enables you to see where market makers are “moving” right now. Are they pushing price away from the sessions start prices, are they crossing the sessions start prices, are they bouncing off of the sessions start prices?
TPA True Price Action confirms those actions, by revealing, who has the dominant power, the bulls or the bears.
Colors of the sessions:
Magenta: Frankfurt session; Aqua: London session; Lime: New York session; Orange: Tokyo session.
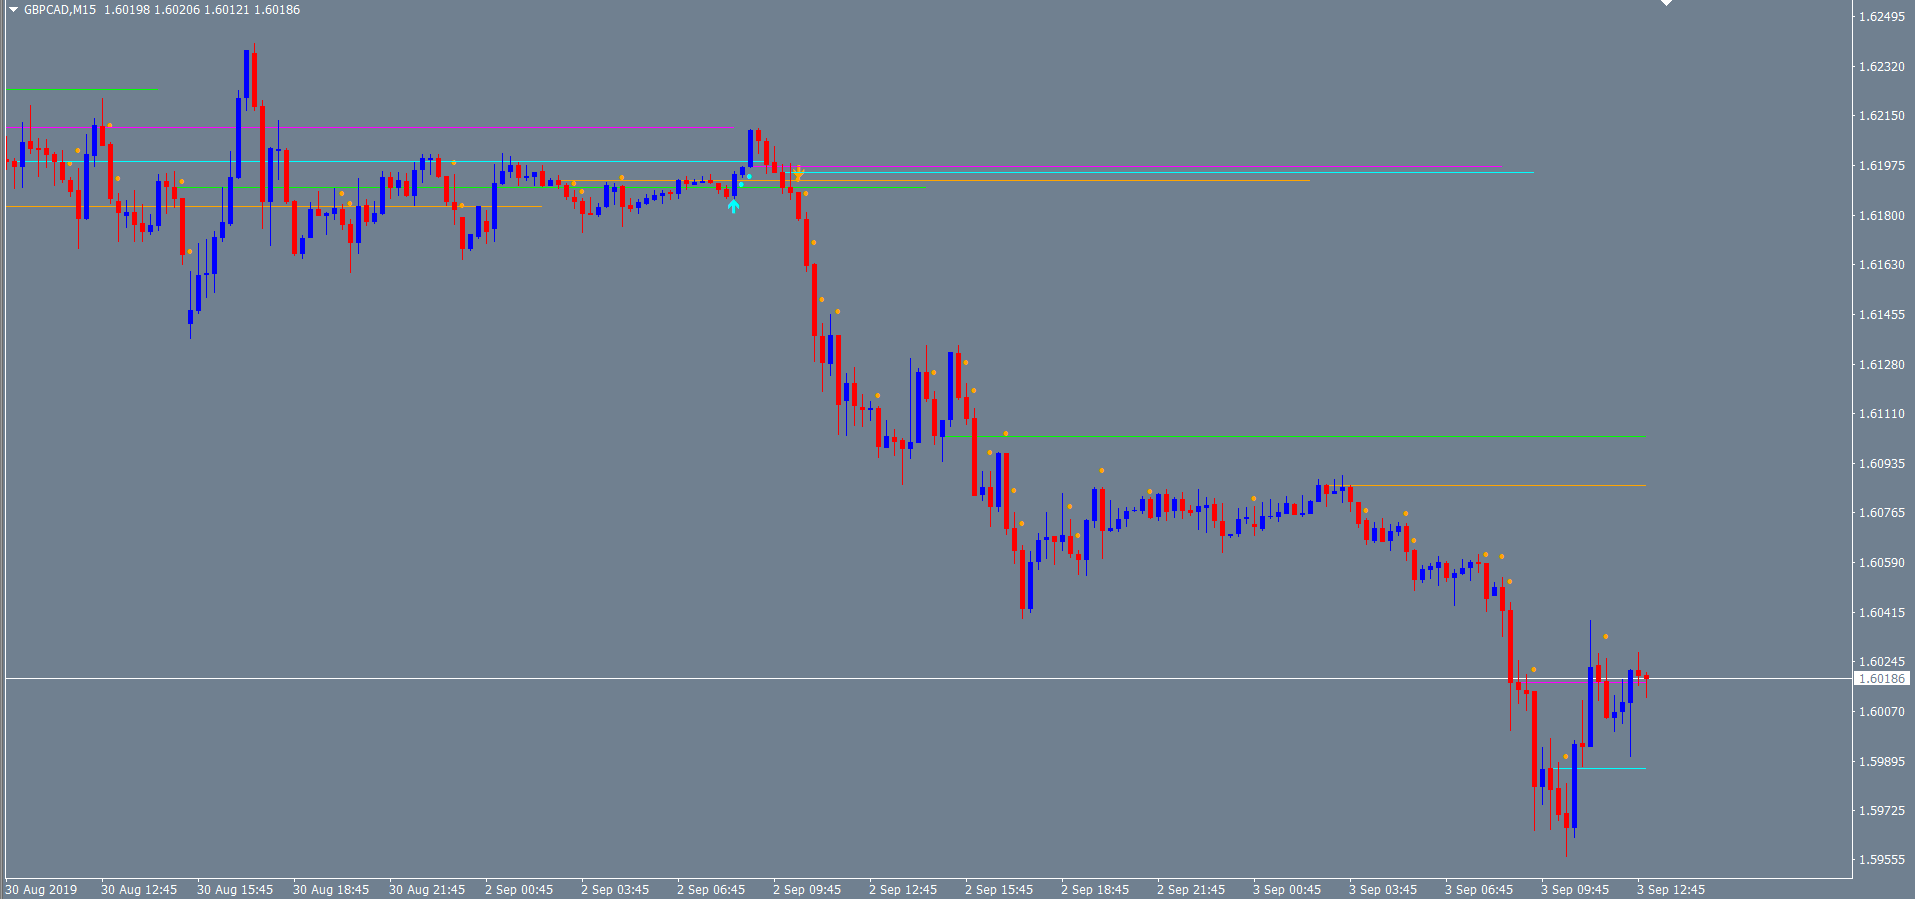
Please take a close look at this picture from todays market.
Significant is the “cluster” of sessions start lines and then the bullish (aqua) arrow, showing that price is driven exactly to the Frankfurt session start of the previous day (please check out that kind of happening all the time, because it happens very often). Right there price turns into bearish direction. This is a typical “behavior” of the market makers, which you can observe very well now.
Due to the setting “21” you get the bearish signal (orange) way later, than you would have get it with all filters off. The True Price Action of the market makers. But as you know already, filters do have two sides.
You can see (without any signal), how price breaks through all sessions start prices and strongly moves short. Due to the setting “21”, you do not get a counter trend signal (the second side of filters) and price keeps moving south.
In the middle of the picture, you can nicely see, that price often does not just moves on through certain levels and when the market makers of the US join in, price finaly breaks through a level, confirmed by TPA signals.
Interesting to see is the more quiet phase after the break of New York session start, where price slowly moves up and then Tokyo session beginns and price keeps on moving short, confirmed by TPA signals.
A simple, but very important thing to look at is, how session start lines appear and in what order and what distance. This allows you to “read” your traded asset way better.
Please remember the tip, to reduce your traded instruments to a fraction, to not get overwhelmed by alerts, but making more profit with less work and stress.
If you are interested: Please check out GBPAUD; GBPNZD and GBPCAD to see, if the huge moves almost every day, are better for your trading or not.
A word to the possible “heads up” alerts:
You can set the distance to the lines in pips and you get only one alert per candle.
That`s it for now. Please stay tuned !
Here is a picture of the settings window for you!
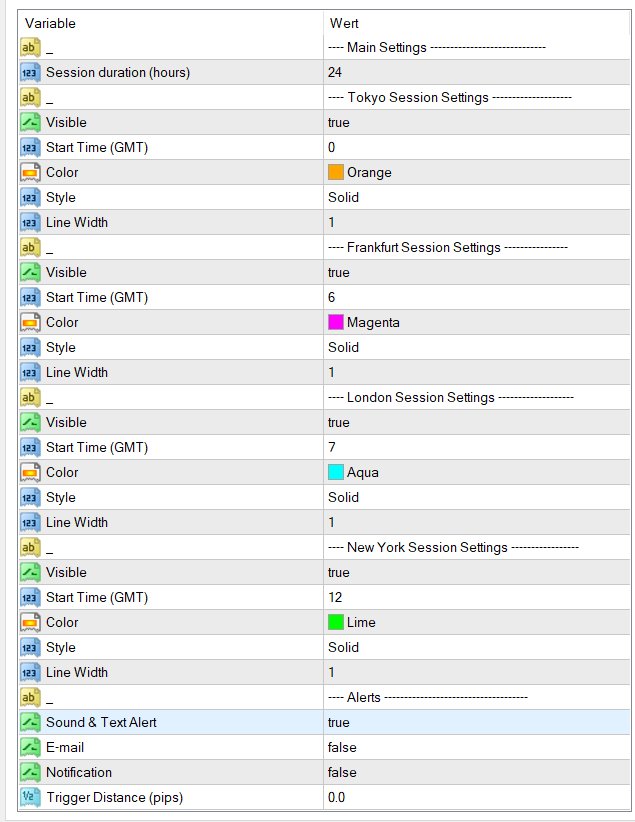
When you put TPA Sessions on your chart, it recognizes your time and the time of your broker. Please check all sessions start points with your crosshair to make sure, you observe correct lines.
Now please take a look at that fraction of todays M15 GBPCAD….just to prove, what happens every day and how exact it happens many times.
Please check out the white circles. Right now the action for today is over, but still…
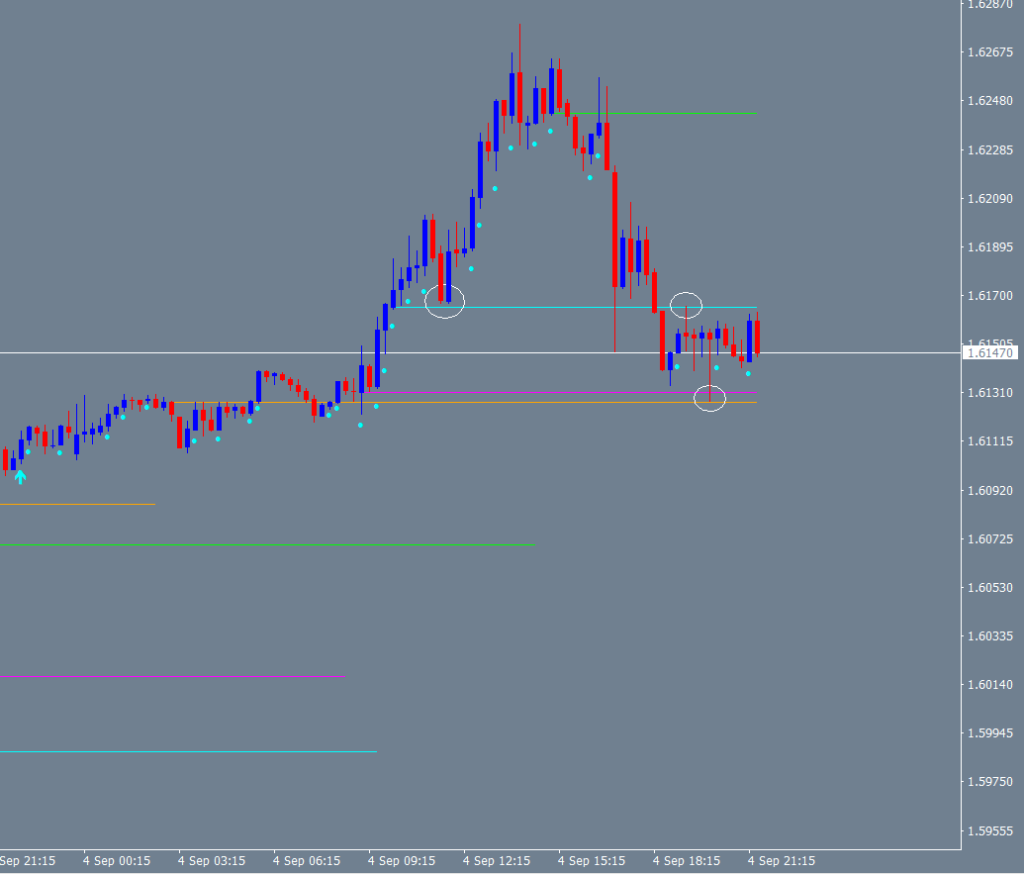
….price is driven exactly to sessions opening prices…
I am sure, that many traders will recognize, how important it is, to track market makers actions! And when that happens, many will leave us a “like” in the form of “5 stars” :-). This will help other traders and us too !
Today is October 17th and we are in the “hot phase” of Brexit.
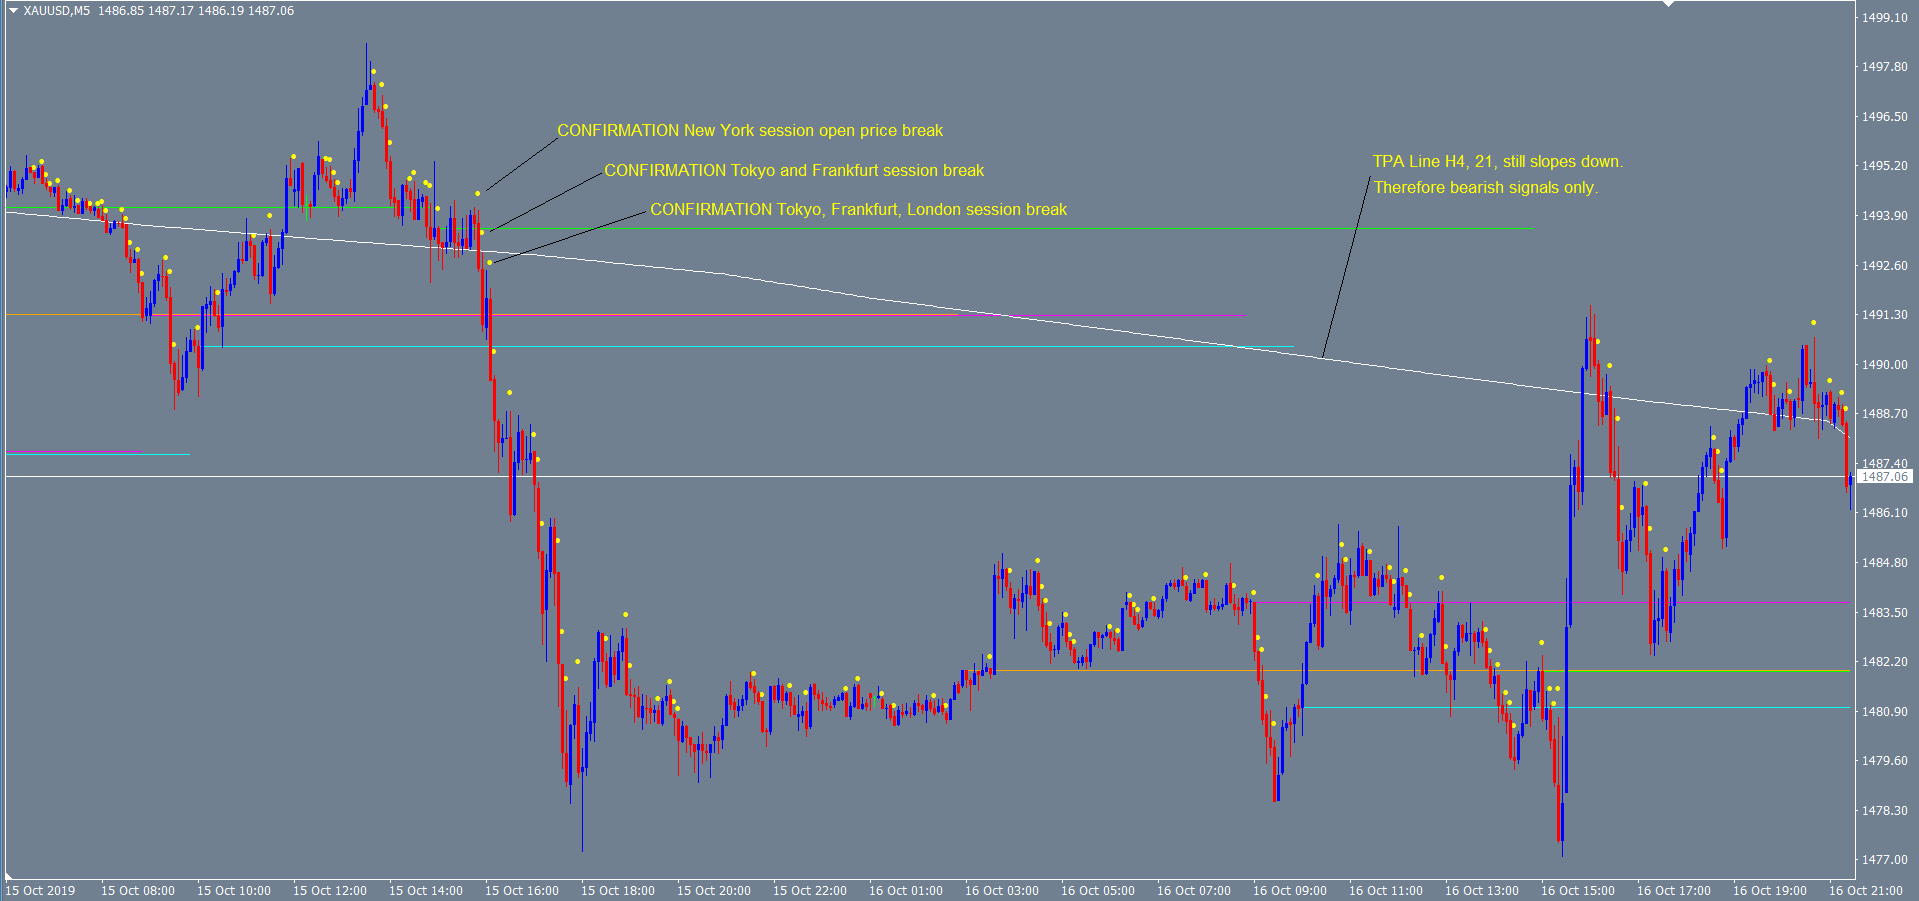
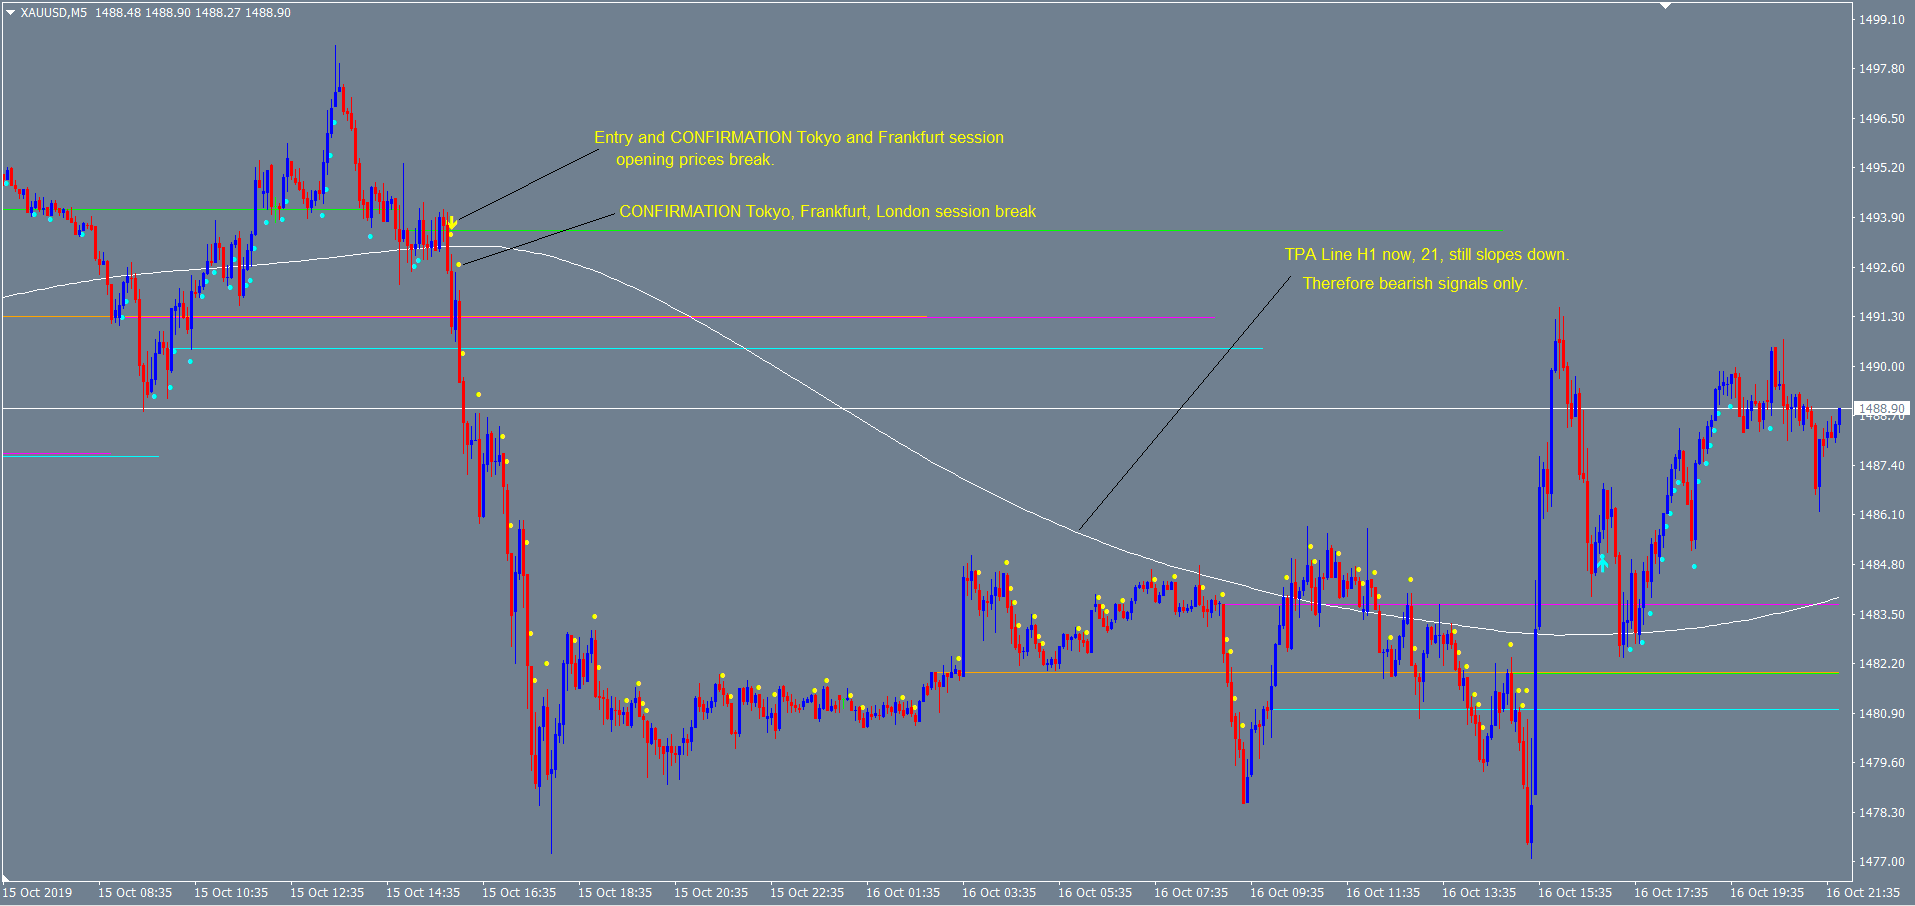
Please take a look at this picture, how marketmakers respect session opening prices and how ascending bullish signals into trend direction demonstrate , who the winner is, in the fight between the bears and bulls.
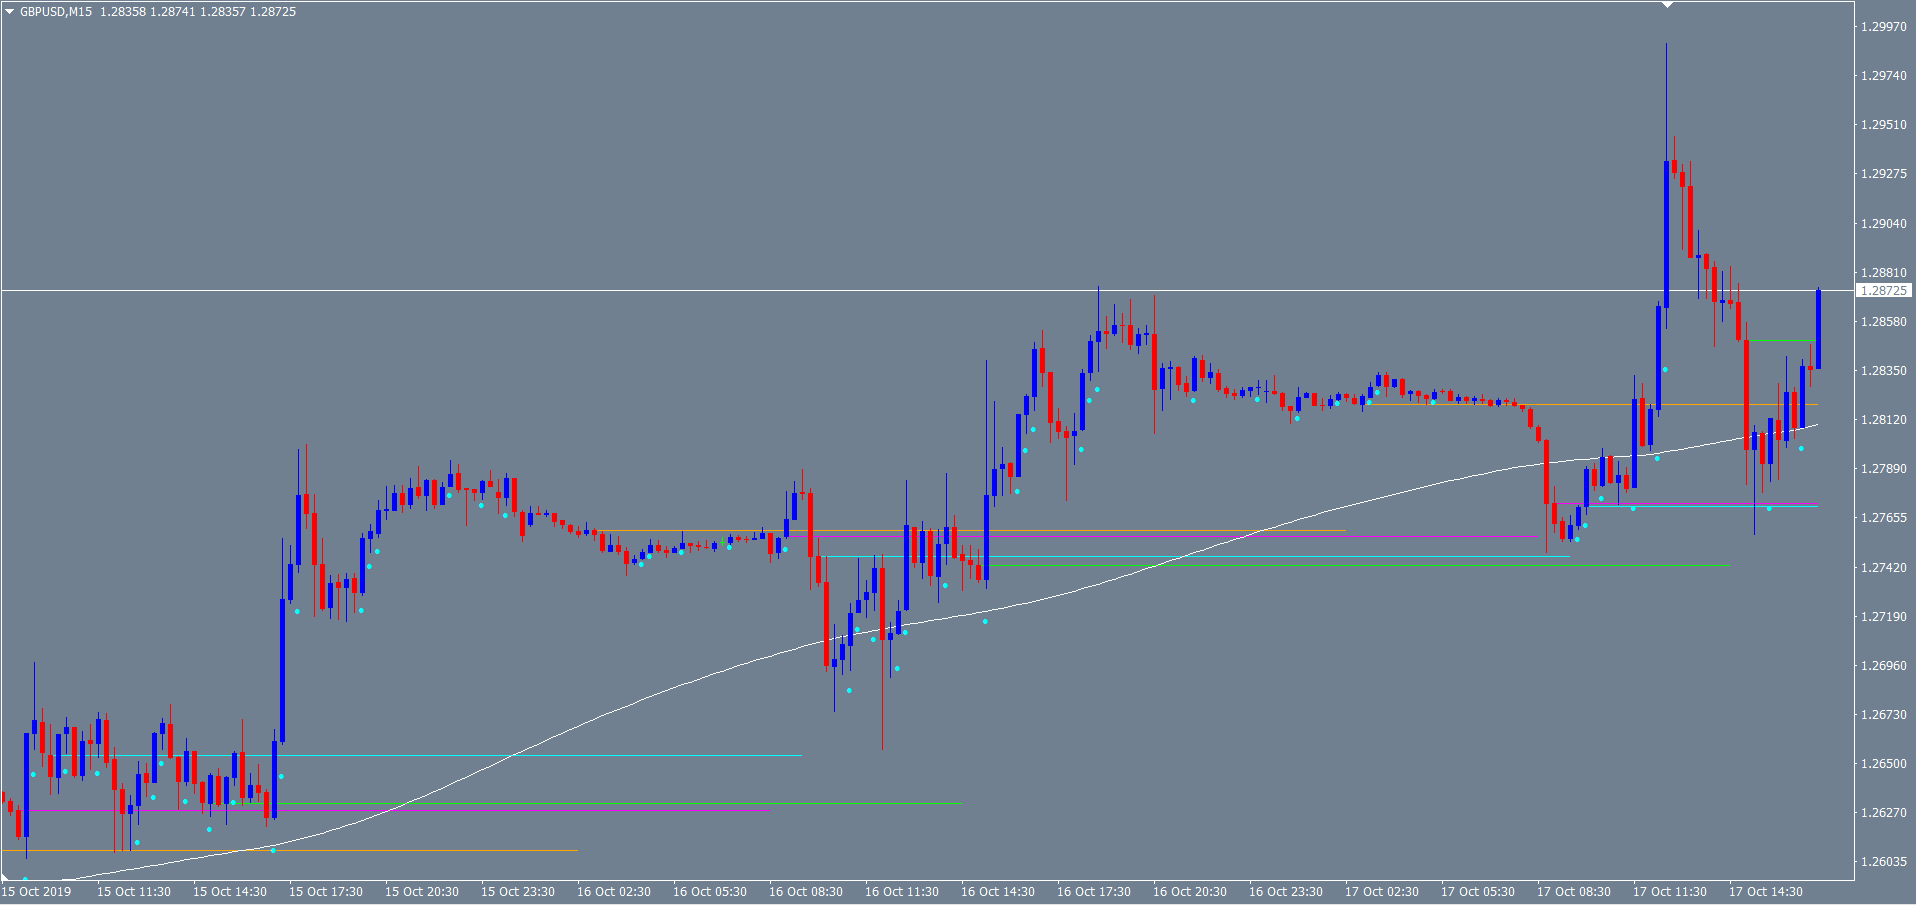
Good to see is, why often candles are generated with long wicks. Now you can see why. Marketmakers drove price back to a session opening price and get back into trend direction within the M15 candle.
I can`t point enough at the fact, that both indicators are NOT the next fancy tools without clear readings. This is price action generated by the marketmakers, without lagging or repainting.
Breaks through session opening prices are CONFIRMED by TPA True Price Action indicator.
You can follow the “footprints in the snow” they are leaving, if you are carefully watch out for ascending signals in an uptrend, after a pullback.
And descending signals in a downtrend after a pullback.
Here are some other, interesting pictures for you :
Here is one of Oil M1 chart without TPA Sessions to show TPA works everywhere:

The strength of the trend, the change of it, can be seen by the slope of TPA Line. Signals are generated into the direction of the line.
Wednesday, January 22, 2020
Hello everyone,
yesterday we started a “Telegram group” for TPA owners. If you like to join it, please send the purchase-line of “TPA True Price Action” from your mql5 account (to the left, “purchases”). You will get an invitation link within a working day, or right after the weekend. TPA renters will get support as usual via email.