Hello TPA traders and welcome to our blog !
We will have a friendly, serious and constructive atmosphere here.
This part of our blog is for TPA only and won`t get as “messy” as on other platforms.
There won`t be 10,000 useless posts about nothing, where everybody will get confused and lost in the end.
We will arrange this blog to make it easy to find all answeres, even when a trader joins us in about six months.
A section with questions and answeres will be build, to find help very quickly.
You will find many screenshots with explanations and live trades to illustrate.
Our goal is to make beginner-and experienced traders able to read between the lines and overcome some “mainstream” thinking, which usually leads to losing most of the time, or even giving up.
Everything you see and read on our blog, is for education only and will never be a trading advice, as trading is in your own responsibility !!!
Ok, let`s start !
TPA True Price Action is NOT another indicator build out of a mix of existing algorithms or a magical fortune teller “get rich over night” tool !!
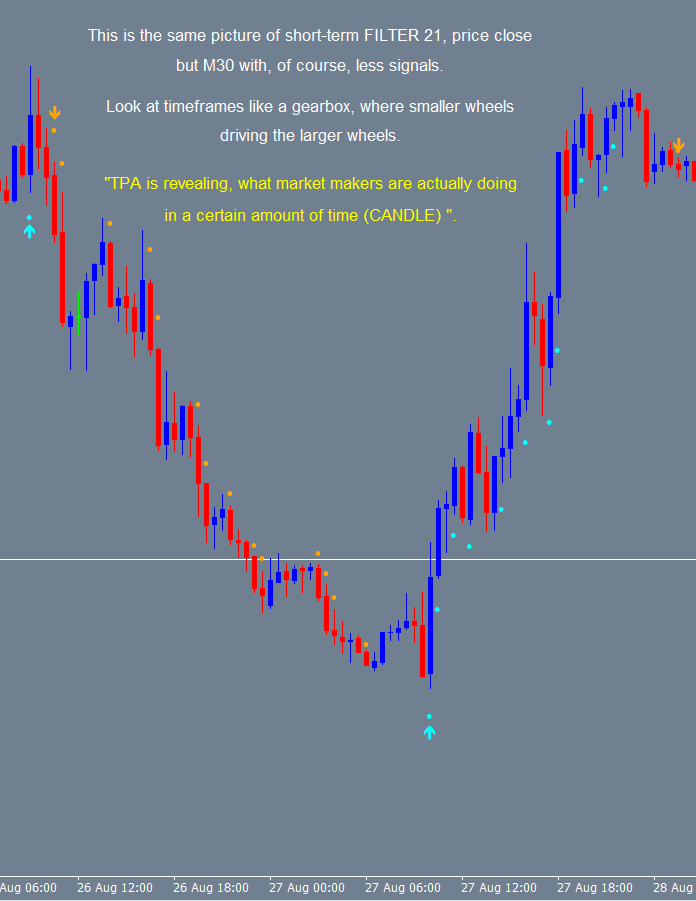
TPA is revealing, what market makers are actually doing in a certain amount of time.
Therefore signals are only generated in the second, a candle closes, to confirm the market makers price action.
As you certainly know, everything can happen during a “open candle” and we need serious informations, not a “maybe” !
If a M15, or a H1 candle, for example, is closed, you know for sure, who is in control and dominated the market, the bulls or the bears.
And here is the difference between TPA and common indicators.
TPA shows the facts about the bulls or bears and common indicators do, what they are supposed to do:
“Indicate”, based on a mathematical formula, but not based on real actions in the markets. Especially indicators moving between a boundary of 0/100, like Stochastics.
Don`t get me wrong, I am not saying that those indicators are not profitable in some situations.
But what I say is, that you are the only person who knows exactly how many times a “overbought/oversold” and “differgence” situation, “fooled” you into many losses over the years.
One very important reason, why we developed TPA, is:
What about “convergence” in the logic of MACD ???
You know, M_oving A_verage C_onvergence D_ivergence.
What indicator signals ALL candles moving “convergent” ??? Not A SINGLE ONE does !!!
What about all the missing opportunities to follow the market makers candle by candle, one after the other and/or reentries after a pullback, or a “discount move” to convince “the others” to join in, to go into the same direction? (Just one example of “reading between the lines” ).
Did you ever asked yourself, while staring at Stochastic, RSI or CCI or what ever indicator, why doesn`t it trigger an alert on every candle, maybe five in a row, with the same color ???
TPA shows exactly what is going on between the bulls and the bears !
Without repainting or recalculation, candle by candle, even ten in a row with the same color. If there is an arrow with a dot, or just a dot, it stays there, no matter what happens next, no matter what market, no matter what timeframe. (One example of overcome “mainstream” thinking)
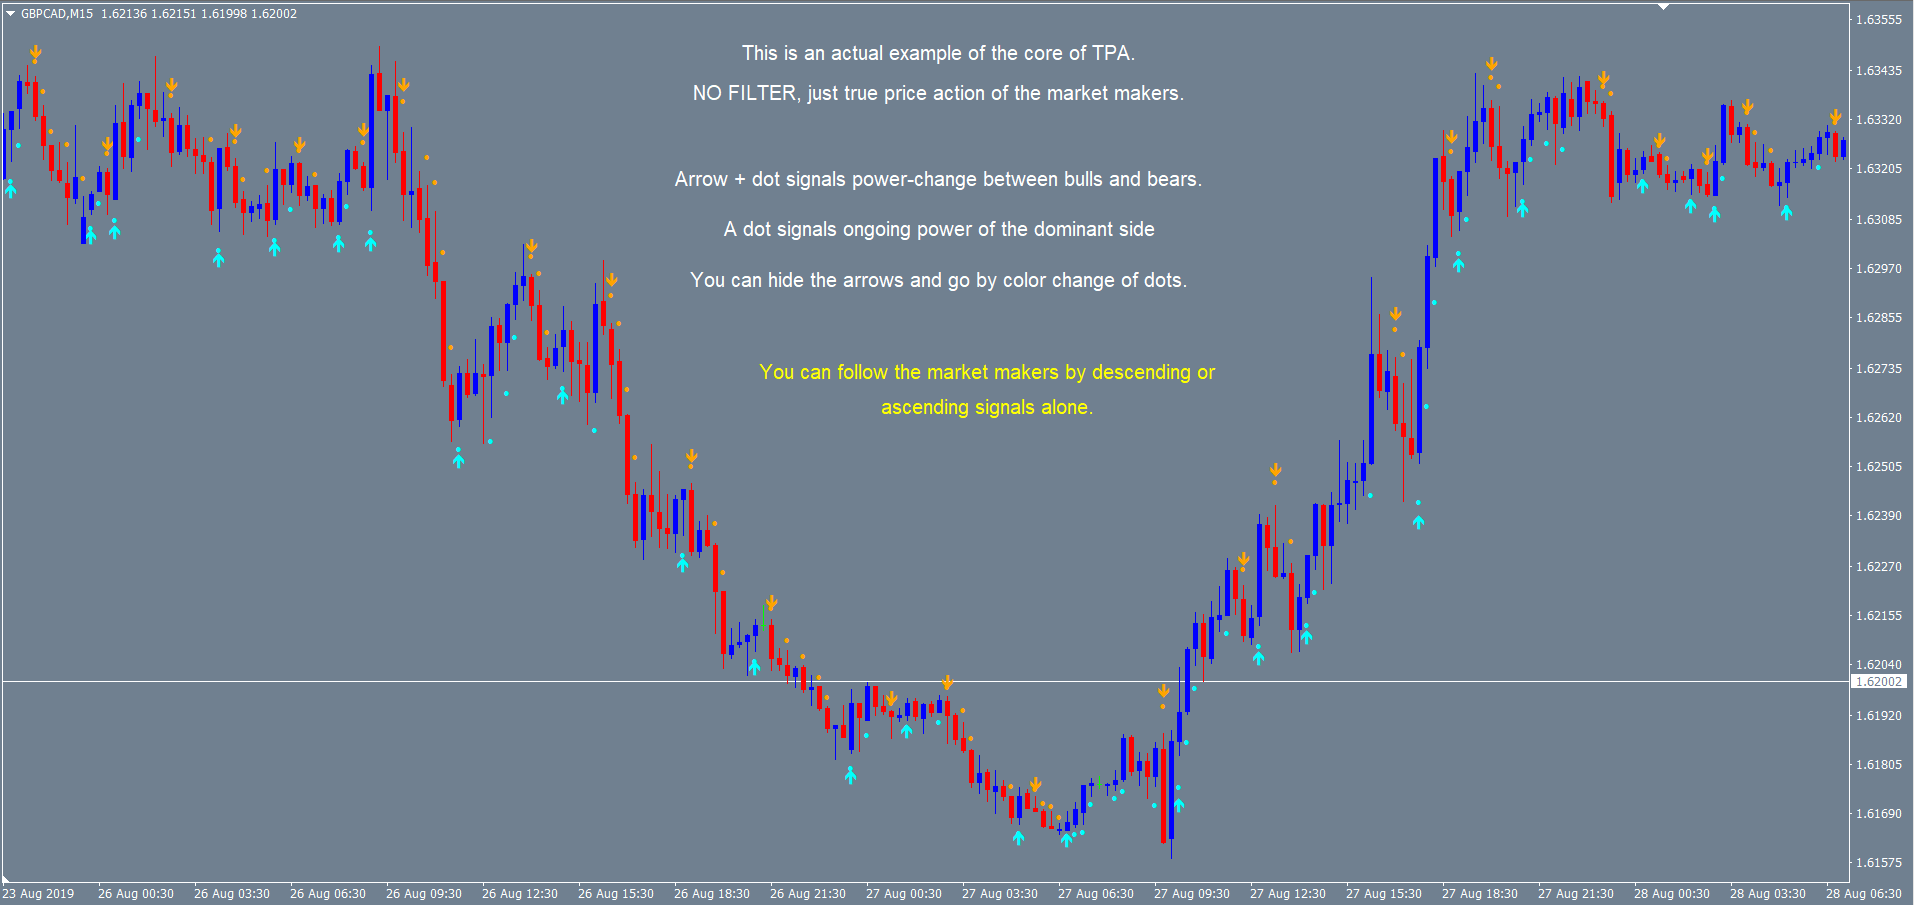
“Arrow with dot” signals a change in control between the bulls and bears. You can turn off the arrows, if you don`t need that extra information, or if you want less signals on your chart. You can see the “change” by the different color of the dots too.
“Dot” signals a reentry, or a scale in (add on) trade into the current trend direction.
One of the tremendous advantages of TPA is, that you can reduce your traded assets, or instruments, to a fraction of what you are used to !!
Why? Because “convergent” trading, or following the market makers, signal by signal, enables you to produce more profit with less instruments.
Imagine what that means to your everyday life as a trader ! If you can overcome the “mainstream” thingking, not to miss a trade on every of the 28 forex pairs, or being present at all markets at the same time, of course 🙂
More details will follow, with examples and pictures.
So please stay tuned !
Hello, TPA traders ! Thank you for your patience! 🙂 Two days later now.
Please do not forget to read from the start (if you jumped right to the fresh post), to make sure, you don`t miss important things to know !!!
Today I show you a pictures without any filters, the core of True Price Action of the market makers. The meanings of arrows and dots will be explained also.
True, because that way, you get ALL signals right away. Those, which show the beginning of a pullback (or a “discount-move”). Those, which show the reentry back into trend direction. And those, which show the end of a move and the beginning of the move into the other direction.
Yes, of course those signals too, which occur in flat, or consolidation phases and leading not into a extreme profitable trend with many reentries 😉 We will talk about those situations later.
Remember “convergence”? Every singel candle with definitve power into the same direction, triggers an alert at close by TPA.
The second picture of today, shows the same situation, but with short-term filter, default settings. We used those settings, because market makers are using them since many years, until today.
As you may know, using a filter, has always two sides.
One: It can avoid needless and costly exits in the middle of a beatiful move, just because of one or a few unimportant candles into the opposite direction.
Two: It “cuts off” the beginning and the end of a move, because of setted “periods” and therefore “late” signals. Think about higher timeframes with setting 21 and how long it takes, until you get the awaited signal.
You can decide either to use “faster” settings, to get earlier signals after the start and end of a move, or “slower” settings, to get signals later. Maybe “safer” signals, maybe “to late” signals to make profit.
Key is to find a balance and not to think, there is the “one” setting for all market situations, a common, mainstream taught thinking.
Different market situations require different settings, if a filter is used at all.
Ok, here is the first picture I was talking about. You guessed it right, the action starts after Frankfurt and London sessions open on the left and holds even after Tokyo session. The next day, same action, but into the other direction after sessions start all over.
You all can get a extraordinary tool, complementing TPA True Price Action in the next days. We tried to publish it earlier, but there is just to many work to do. We are sorry.
Please take a look at the “flat” or consolidation phases too. This happens mostly outside the sessions, when market makers “count their profit” ;-).
Please compare picture number two, The one with default short-term filter.
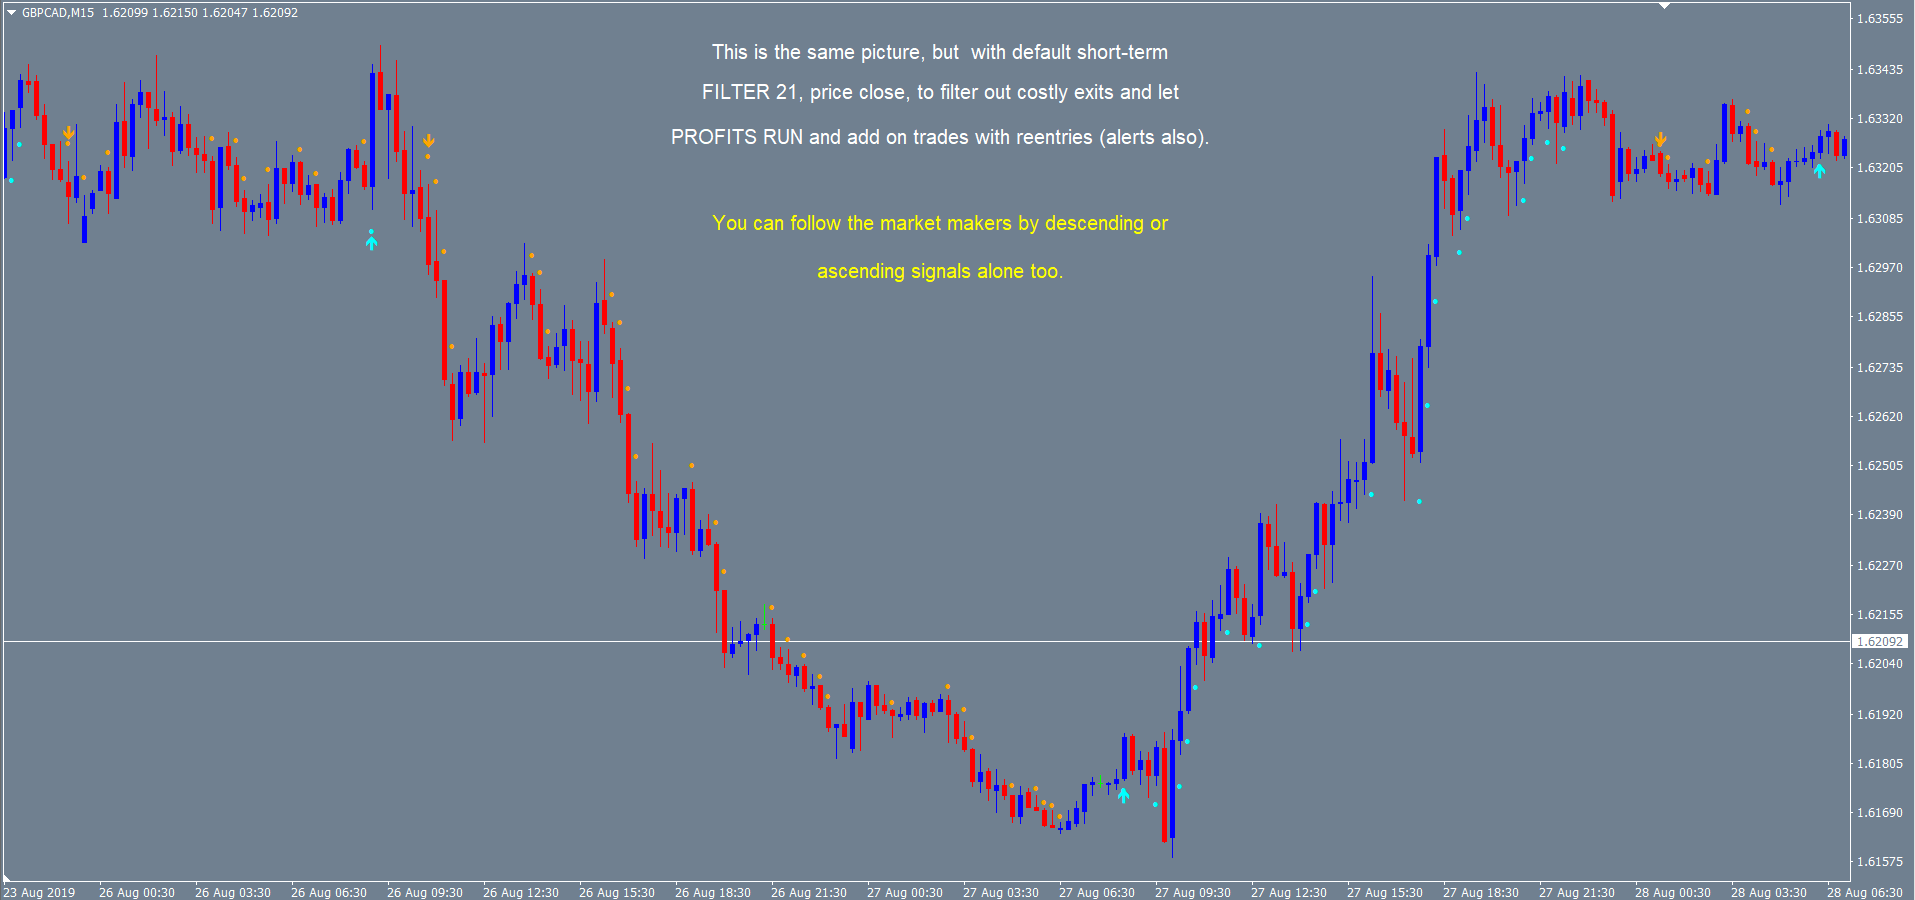
As you can see, you get no “counter trend” or “needless and costly” exit signals in the middle of a nice trend.
As Valentin Popa, one of our TPA traders, said correctly:
“…The real time trading shows us, that you never know, if the market is trending, or not. In real time, a trend can start at any time. So we just don`t know in the middle of the trading day, how to choose the settings”
If you find yourself in these words, than please “blink” :-).
But seriously, what else can you do as a retail trader (and not fortune teller), than follow the market makers and the power they show, by steep ascending or descending candles and the signals of TPA (no matter what timeframe you trade) ???
“Magic” settings doesnt exist, but good and flexible settings do exist. Thats why I explained the “faster” and “slower” settings above.
Setting 21 is a fibonacci number in time and so are other, faster settings like 13, 8, and 5 too. Fibonacci in time, whaaat? Please check with your “Crosshair” candle counter in different timeframes, how often exactly, or close to fibonacci numbers, moves start and end….
If you choose 21, price high, in a downtrend, you “allow” the market makers a longer, a wider “excursion” in a common counter trend move and you can get a earlier reentry signal, when it is over and it goes back into trend direction.
This is just a tip for you and of course not a “magic setting” either.
And here is a third picture for today to help understanding, that the timeframes are like the wheels of a gear box. Please use this to your advantage!
That`s it for today. Please stay tuned !
Wednesday, January 22, 2020
Hello everyone,
yesterday we started a “Telegram group” for TPA owners. If you like to join it, please send the purchase-line of “TPA True Price Action” from your mql5 account (to the left, “purchases”). You will get an invitation link within a working day, or right after the weekend. TPA renters will get support as usual via email.